What did your agent do last night? Wiring Hermes into OpenTelemetry
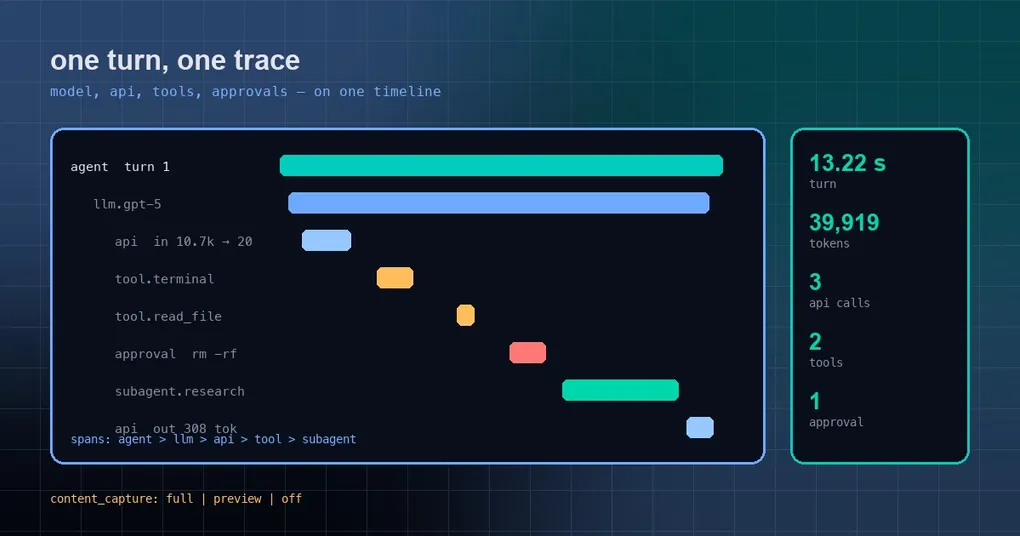
You wake up, open the laptop, and the “just tweak the config” job you left running overnight cost a few dollars more than usual. /status tells you the total token count and nothing else. What you actually want to know is which model call was slow, which tool retried three times, and which approval sat there for two minutes waiting for a click. Hermes does not ship that per-call timeline, but the community plugin hermes-otel fills exactly that gap: it wires Hermes into OpenTelemetry and turns one turn into one trace you can expand layer by layer.
The two built-in observability surfaces do not cover “this one call”
Hermes already ships two. The first is gateway monitoring (monitoring.export.otlp), which watches gateway and cron health and is content-free by design — no prompts, no tool calls, no tokens. The second is the bundled Langfuse plugin, which records per-run traces but only sends them to Langfuse.
hermes-otel is the third, run-level surface, and it runs alongside both. It attaches to the host’s lifecycle hooks and installs its own TracerProvider, so it never touches the private provider objects the core exporter builds. The two datasets do not overwrite each other.
Install: one command, one gateway restart
The plugin is in the curated catalog (community tier, pinned at 1.18.2):
hermes plugins install hermes_otel
hermes plugins enable hermes_otel
Hermes 0.21 and newer installs the plugin’s three opentelemetry-* dependencies into its own virtualenv and re-applies them after every hermes update. Restart any running gateway afterwards.
Older than 0.21, or installed with --no-deps? Add the dependencies yourself:
<hermes venv>/bin/pip install -r ~/.hermes/plugins/hermes_otel/requirements.txtWhat one turn looks like when you expand it
The plugin maps host events onto spans, roughly like this:
agent / cron                       <- the root span for the whole turn
├── skill.{name}                   <- a loaded skill, open until the turn ends
└── llm.{model}                    <- one run_conversation
    ├── api.{model}                <- one HTTP round-trip, with tokens and finish reason
    │   ├── tool.{name}            <- each tool call: args, result, outcome
    │   └── approval.{pattern}     <- waiting on a human or the smart guardian
    └── subagent.{role}            <- delegate_task, the child's own trace nests here
api.* spans carry a hermes.query_source attribute that says whether the call came from the agent loop itself (main), a delegated child (subagent), or was made on the agent’s behalf (auxiliary — titling, compression, Mixture-of-Agents aggregation), with hermes.auxiliary.task naming the job. Tool spans carry hermes.tool.outcome: completed, error, timeout, blocked or cancelled. Attributes are emitted in both OpenInference and OTel GenAI conventions, so Phoenix and Langfuse both work without custom mapping.
Configure it with one YAML file — or one environment variable
For a single backend you do not need a config file at all:
export OTEL_PHOENIX_ENDPOINT=http://localhost:6006/v1/tracesFor several, create ~/.hermes/hermes_otel.yaml:
project_name: hermes-agent
backends:
  - type: phoenix
    endpoint: http://localhost:6006/v1/traces      # traces only
  - type: lgtm
    endpoint: http://localhost:4318/v1/traces      # traces + metrics + logs
    metrics: true
  - type: honeycomb
    api_key: ${HONEYCOMB_API_KEY}                  # ${VAR} expands at load
capture_logs: true
Backends are fed in parallel, each with its own export queue. The repo’s docker-compose/ directory has a ready stack for every self-hostable backend, so standing up Phoenix or Jaeger locally is the shortest path to a first trace.
Privacy: full content by default, so switch to preview
Read this part first. The default content_capture: full sends the complete prompt and response of every model call, plus tool arguments and output clipped to 1200 characters, to whatever backend you configured.
| Value | What leaves the process |
|---|---|
full |
Full prompt and response, tool content clipped to 1200 chars |
preview |
Clipped previews only |
off |
No content at all, structure only |
With no backend configured, the plugin keeps a local SQLite store under $HERMES_HOME for its dashboard and sends nothing. With multiple profiles, remember each profile has its own install, settings and telemetry, and a multiplexed gateway traces every profile it serves under its own name.
Ask from the chat, without touching a backend
The plugin ships a skill, hermes_otel:observability, with a terminal query tool. Once installed you can just ask “why was my last turn slow?” or “what did this session cost?”, and it reads the local live store — no backend required:
python3 ~/.hermes/plugins/hermes_otel/skills/observability/scripts/otel.py trace lastThe output is a readable waterfall with per-span duration, tokens, cache hits and finish reason. Subcommands include status, traces, span, sessions, stats, metrics, logs and a read-only sql, all with --json, --since and --source.
When you should skip it
- If you only want to know whether the gateway is alive, the built-in gateway monitoring is lighter and content-free by design.
- If Langfuse is your only backend, the bundled Langfuse plugin already covers you.
- On a small box running lots of tiny tasks, per-turn spans have a cost. Start with
previewplus sampling for a week before making it permanent.
Two honest limits: linking MCP server spans into the agent trace is implemented on the plugin side but still waits on host support, and the plugin fails open — its exporters run on their own threads, so it is not an audit log. If you need evidence that survives a crash, keep the local store or export to a backend you control.
If you are still choosing plugins, start with how the plugin catalog works — hermes plugins search tells you which commit a plugin is pinned to. To browse these spans in a browser workspace, Hermes Workspace pairs well with it, and the command details live in the hermes plugins reference.