Every session freezes at once, the log stays clean: Hermes moves eight measured blockers off the event loop
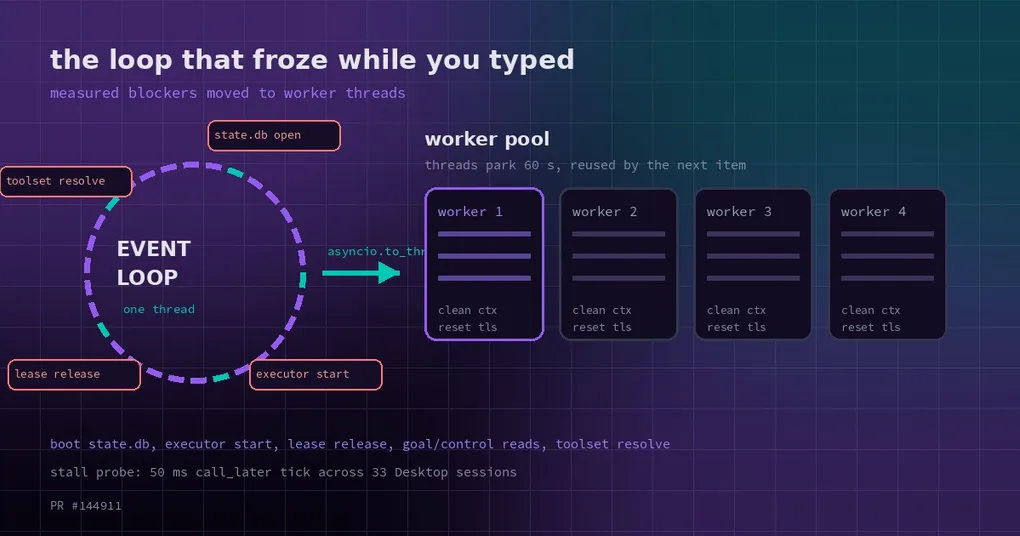
It is a Wednesday afternoon and you are halfway through a sentence in Desktop when the window stops responding: the caret still blinks, but nothing arrives, and the session list in the sidebar is frozen mid-scroll. You wait thirty seconds and it comes back on its own, or you restart and it comes back that way. Then you open the log to see what happened, and there is nothing in it — not a warning, not a single line. It was not the model and it was not the network: the Desktop backend, the gateway, runs on a single-threaded asyncio event loop, and anything that waits on disk on that thread makes every session wait with it.
The event loop is one cashier with every session in line
The gateway is the process behind Desktop. It owns session storage, tool calls, cron, and the state.db of every profile. It does not run a thread per job. It uses asyncio to take turns on one thread — read a WebSocket frame, push a token, write a session, run a tool — one at a time, each quickly enough that it looks concurrent.
That model rests on an assumption: every one of those turns has to be fast. The moment one of them waits on disk — opening a database, taking a file lock, rewriting a JSON blob — the thread stands still and nothing else happens. Your keystrokes stop echoing, a streaming reply dies mid-sentence, a cron job that was due does not fire. The cashier is in the back room looking for stock. And blocking I/O does not raise: it is just slow. That is why the log is clean, and why this class of stall is so hard to argue with.
For the other half of the story — what catches a loop that has already stalled — see the gateway loop watchdog write-up. This one is about why it stalls.
Eight blockers, all of them measured
PR #144911 (merged 2026-10-27, merge commit b63fbbac4d27d1e4b8585ff7065e6dceb6207394) did not guess. Each of the eight corresponds to a path someone could reproduce, and together they close #141966, #142085, and #142061.
-
Session reads waited up to 5 seconds on the token writer (#141966).
get_session,list_sessions_rich,get_recent_session_model_route, andlist_gateway_sessionsare pure reads, but they would wait for a writer in the middle of persisting a token — five seconds in the worst case. The fix gives reads their own flush mode: on the loop thread it never waits, and off the loop thread it waits as before. Only a wait on the loop thread spends everyone else’s time to save its own. -
The liveness probe held the GIL on Windows (#142085, from community contributor @zwmaupin). A psutil probe on Windows can hold the interpreter lock long enough that the loop thread cannot get it, which is a full stop for the event loop. This one was salvaged from @zwmaupin’s fork, with authorship preserved.
-
Startup opened each profile’s
state.dbon the loop. Every open builds the schema and the FTS index — roughly a second per store — and it used to happen on the loop thread, so more profiles meant a longer dead patch at startup. Nowopen_profile_storeopens inside a thread with the profile scope bound in that thread, secondary profiles warm up concurrently, and the store startup actually needs is pinned by a worker aroundGatewayRunner(), so the store’s own open becomes a registry hit and never touches the file. -
Every executor submit started a new thread on the loop (#142061).
Thread.start()waits for the GIL, which means the act of handing work off was itself spending loop time. This is the most interesting of the eight, and it gets its own section below. -
The goal/loop manager load and control-card snapshot after each turn both read
state.db, both on the loop. -
Per-turn display/toolset resolution took the auth store file lock. It now runs through
asyncio.to_thread, with the copied context carrying that turn’s profile scope. -
restore_local_sessionwaited onstore._lockfor live sessions. A worker writing tostate.dbholds that lock, so restoring a session could hang the whole loop behind it. The fix found a precise hole: when the route already names a target and that target is in the lineage, the locked branch does nothing at all — that case now returns without taking the lock. -
Active-session lease release at the end of each turn did a file lock plus a JSON rewrite. Also moved off the loop.
Six of the eight were “touching disk on the loop”, one was “fighting for the GIL on the loop”, one was “starting a thread on the loop”. If you keep one rule from this: nothing that can wait belongs on the loop thread.
Parking a thread for 60 seconds
Item 4 is worth reading closely, because it does not relocate a call — it changes how a pool behaves.
The executor used to be simple: a task arrives, a thread starts, the thread finishes and dies. The pool is unbounded by design (that contract, and the OS thread cap, are unchanged), so under load it was starting and burying threads continuously, and each Thread.start() queued behind the GIL on the loop thread.
Now a worker that finishes does not die. It parks for 60 seconds (_IDLE_TIMEOUT_S = 60.0 in the code). The next submit hands its task to a parked worker over a queue; a thread is created only when no worker is parked. The pool stays unbounded, the contract holds, and in steady state almost no threads are created at all.
The danger in reusing a thread is leftover state: a contextvar, an interrupt flag, a thread-local from the previous job quietly steering the next one. That is where most of the care in this change went. Every task runs in an empty contextvars.Context, and gateway/turn_thread_reset.py clears this thread’s residue:
- the thread’s
tools.interruptbit; - the turn’s reason and yield;
- the sudo cache’s thread scope;
- the per-turn
threading.localnamespace.
A worker that fails to reset retires instead of taking more work — better one thread short than dirty state leaking into the next turn. _threads still lists only busy threads, so the drain counting at shutdown is untouched.
Late is fine. Out of order is not.
The cost people forget when moving work to threads is ordering. Three places here were designed around it.
Ticket numbers for snapshots. The control-card snapshot is now read in a worker and published asynchronously, but publish_async takes a ticket on the loop first. A snapshot that arrives late and has already been superseded by a later publish is dropped, so the UI never sees old data painted over new. Per-tool republish stays synchronous, because test_session_viewer_automation requires it to complete within a single loop step.
One ordered worker for lease release. Every release (file lock plus JSON rewrite) goes to the same ordered worker. If a release lands after the next acquire on the same session, it does nothing — entries are discarded by lease id, so a late release cannot clobber the turn that just took the slot. The module docstring in gateway/active_lease_io.py is explicit about the boundary: only the file write is deferred, the lease is already released from this process’s point of view by the time release_soon returns, so the next claim still sees the slot free; routing every release through one worker is what keeps the persisted discard in turn-completion order; and the registry path is fixed at acquire time, so the worker needs no profile scope.
Copied contexts carry profile scope. The to_thread in item 6 is not a bare call — the context it copies carries that turn’s profile scope, or display/toolset resolution inside the thread would fall back to the default profile.
The common thread: deferral is only safe where the result converges to the same state. Where order carries meaning, take a ticket or get in line.
How to check it: measure how long the loop stopped, not how slow a request was
You cannot find this class of bug with per-request latency. Under load every request looks merely slow, while what the user experiences is everything stopping at once. The measurement setup in the PR is worth copying:
A real gateway run --force in multiplex mode, 11 profiles, 33 concurrent Desktop-shaped WebSocket sessions, one cron job per profile per minute, and a loopback tool-call provider. Two probes injected via sitecustomize: a 50 ms call_later loop-latency probe, and a stall sampler that captures stacks when the loop stops turning, so you can see who is waiting. Each round runs 90 seconds, with PYTHONPATH pinning the code tree so you are measuring the code you meant to measure. Stall seconds = main-loop stall samples × 20 ms.
The point of that setup is not the numbers. It is that it measures how long the loop went without turning, which is the thing your fingers actually feel.
Triage the same way. If only typing stutters while replies keep arriving, that is the rendering path — see why typing degrades in long sessions. If typing and replies stop together, recover on their own after tens of seconds, and leave a clean log, the loop was occupied. And if what is slow is the moment you launch, that is a third problem entirely, covered in startup latency and scratch cleanup.
Which versions, and what to do now
The fix merged into main on 2026-10-27. If you track the stable channel it reaches you in the next release that carries it; if you want it today, switch to tracking main. Of the three issues, #142085 is the one Windows users will recognise instantly — a tool call starting and the entire UI going wooden is that signature.
Until then, a few things give the loop more room: fewer long-lived Desktop windows (each one is a WebSocket session pushing messages continuously), turning off cron for profiles you are not using, and not stacking dozens of concurrent sessions on one gateway. The test environment for this PR was 11 profiles at 3 sessions each — that is already the stress case.
The fingerprint of this kind of stall
A slow model and a stalled loop feel nothing alike, and telling them apart is most of the debugging. Slow model: tokens arrive one at a time, the UI stays responsive, you can type and switch sessions. Stalled loop: every session freezes simultaneously, including ones that are not calling a model at all; the log has no errors, because blocking is not an exception; and it recovers by itself, because the disk operation eventually finished.
The third case is the nastiest, because it is not slow — it is stopped. And a stopped event loop looks exactly like a broken machine, when all it was doing was waiting on one file write. What this change does is send that write somewhere else to wait.